
From Sapling Counts to Green Infrastructure Proof
The management question behind the week
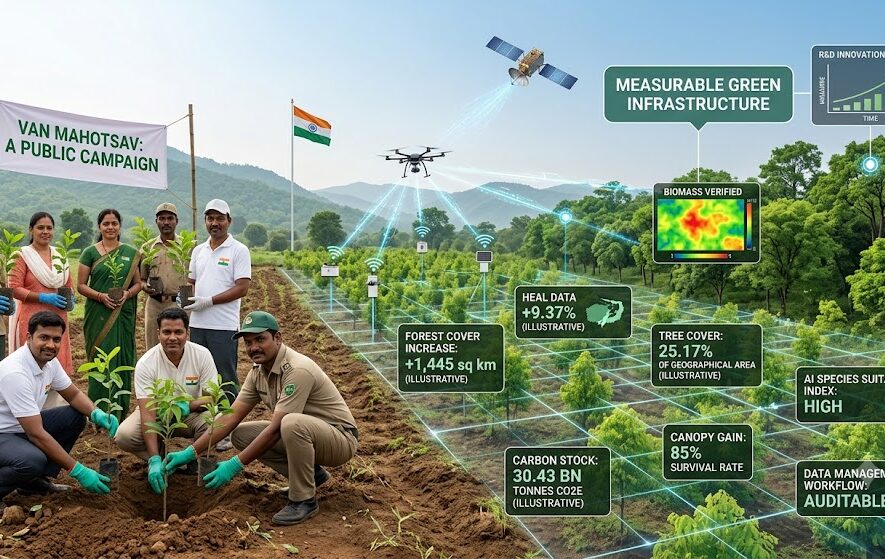
Every July 1 to 7, India observes Van Mahotsav, started in 1950 by K. M. Munshi, then Union Minister for Agriculture and Food, to build public enthusiasm for forest conservation and tree planting [1]. The occasion gives corporate sustainability and R&D teams a useful test: what evidence proves that a plantation drive became lasting green infrastructure?
For R&D investors, this is not a communications issue. It affects technology selection, data workflows, regulatory strategy, carbon claims, IP strategy, and commercialization decisions. A sapling count says what was attempted. Survival data, canopy data, species data, geospatial records, and maintenance records say what was achieved.
A plantation programme should be run like a clinical trial for landscapes. The intervention matters, but the protocol, baseline, follow-up, and audit trail decide whether the result can be trusted.
The gap is technical before it is promotional
India State of Forest Report 2023 reported total forest and tree cover of 8,27,357 sq km, or 25.17 percent of India’s geographical area [2]. It also reported an increase of 1,445 sq km over the 2021 assessment [2]. The National Forest Policy 1988 envisages at least one-third of the country’s total land area under forest or tree cover [3].
That gap cannot be closed by ceremonial planting alone. It requires technological scaling: better nurseries, species-selection protocols, sensor-enabled maintenance, drone imaging, remote-sensing classification, pest monitoring, soil inputs, AI-assisted analytics, and public dashboards.
That is where IP enters the story. Wherever environmental tools move from pilot to procurement, teams need Technology Transfer planning, patentability review, Prior art search, Freedom-to-operate, Patent drafting and filing, patents where the invention qualifies, and broader IP protection strategy.
| Operational lens | Weak metric: activity | Stronger evidence question: accountability |
|---|---|---|
| Plantation drive | Saplings distributed | How many survived after one, three, and five seasons? |
| Urban greening | Sites covered | Is canopy gain visible in mapped data? |
| Carbon planning | Trees planted | What is the verified biomass and carbon stock contribution? |
| Innovation pipeline | Tool deployed | Is the method validated, reproducible, and scalable? |
Data discipline should come before model ambition
The Forest Survey of India’s ISFR process uses interpretation of remote-sensing satellite data and field-based National Forest Inventory inputs [2]. The report covers forest cover, tree cover, mangroves, growing stock, carbon stock, forest fire instances, and agroforestry [2].
That model matters for corporate programmes. Data Curation, Data Management, and Data Analytics should come before dashboards and AI claims. Artificial Intelligence can help process imagery, identify canopy change, compare site performance, and detect anomalies. But Lines et al. warned that forest-monitoring AI still needs better benchmark datasets because data structure and standardisation affect confidence in forest-property estimates [4].
The lesson is practical: AI should scale disciplined evidence. It should not rescue poor baseline records.
Case module: national reporting as a workflow benchmark
ISFR 2023 reported India’s forest carbon stock at 30.43 billion tonnes of CO2 equivalent, with 2.29 billion tonnes of additional carbon sink compared with the 2005 base year [2]. FAO’s Global Forest Resources Assessment 2025 is also built on official national data and is described by FAO as the only worldwide assessment based on such data [6].
For R&D and regulatory teams, the case is not just the number. It is the workflow: classification rules, periodic measurement, field validation, geospatial interpretation, and policy use. Corporate green programmes need the same logic if they are to support climate reporting, public procurement, sustainability disclosures, or carbon-market participation.
The contrarian metric that should guide investment
Planting more is not automatically better. PIB noted in 2008 that approximately 50 percent of saplings die because of grazing, intense heat, pollution, and neglect [1]. A 2022 synthesis of 176 restoration sites in tropical and sub-tropical Asia found mean mortality of planted saplings at 18 percent after one year and 44 percent after five years, with large site-level variation [5].
That makes the accountability case sharper. A 20,000-tree programme with 80 percent survival leaves 16,000 living trees. A 100,000-tree programme with 10 percent survival leaves 10,000. The larger campaign may create better photographs. The smaller, monitored campaign creates better infrastructure.
From restoration work to defensible commercialization
Green infrastructure programmes can generate technical assets: seedling-protection systems, nursery automation, soil-treatment methods, species-performance datasets, monitoring algorithms, image-classification workflows, chemical input analysis, and visualization tools. Some assets may be patentable. Others may need trade secret controls, database rights, licensing terms, publication strategy, or defensive disclosure.
The strongest IP strategy starts early. Discovery teams should document experimental design. Data teams should preserve provenance. Commercial teams should map users and procurement pathways. IP teams should test novelty, inventive step, freedom to operate, and filing timing before public disclosure weakens protection.
How Saturo Global supports the workflow
Saturo Global supports research, data, and IP teams that need to move from environmental intent to defensible execution. Its capabilities across Data Curation & Management, Indexing & Abstracting, Strategic Patent Support, PatBase, Origin, Chemical Explorer, and Data Visualization can help teams organize evidence, analyze technical spaces, and communicate decisions clearly.
For green infrastructure and related R&D programmes, Saturo Global can support prior art search, freedom-to-operate support, patent landscape support, patent drafting and filing support, and IP protection strategy across restoration technologies, remote-sensing workflows, agritech tools, chemical inputs, nursery systems, and monitoring platforms.
Schedule a demo for a walkthrough of Minesoft PatBase and Origin.
References
[1] Press Information Bureau. 2008. Van Mahotsav. PIB. Link. (Press Information Bureau)
[2] Press Information Bureau. 2024. Union Minister Bhupender Yadav Releases India State of Forest Report 2023. PIB. Link. (Press Information Bureau)
[3] Press Information Bureau. 2022. Assessment of Forest. PIB. Link. (Press Information Bureau)
[4] Lines, E. R., Allen, M., Cabo, C., Calders, K., Debus, A., Grieve, S. W. D., Miltiadou, M., Noach, A., Owen, H. J. F., and Puliti, S. 2022. AI applications in forest monitoring need remote sensing benchmark datasets. IEEE Big Data. DOI: 10.1109/BigData55660.2022.10020772. (arXiv)
[5] Banin, L. F., et al. 2022. The road to recovery: a synthesis of outcomes from ecosystem restoration in tropical and sub-tropical Asian forests. Philosophical Transactions of the Royal Society B. DOI: 10.1098/rstb.2021.0090. (UK Centre for Ecology & Hydrology)
[6] Food and Agriculture Organization of the United Nations. 2025. Global Forest Resources Assessment 2025. FAO. Link. (FAOHome)